
WHAT IS PROJECTOR LOCATION CALCULATOR?
DATA ENTRY
In order to create the report, the Projector Location Calculator needs some information about the project. Cinema Tools does not store or record any data that is entered into this form.
ID DETAILS
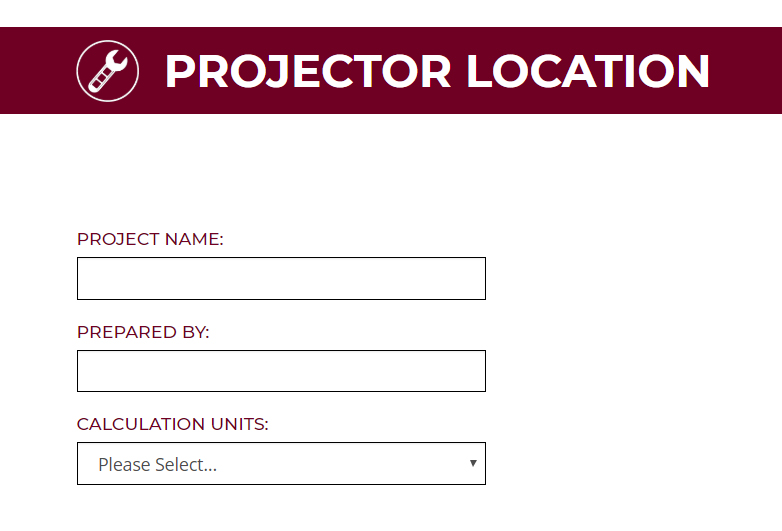
Project Name:
Enter the project name so that the report can be easily identified
Prepared By:
Enter the name of the person creating the report
Calculation Units:
Select the measurement units that will be used in the other form fields
PROJECT DATA
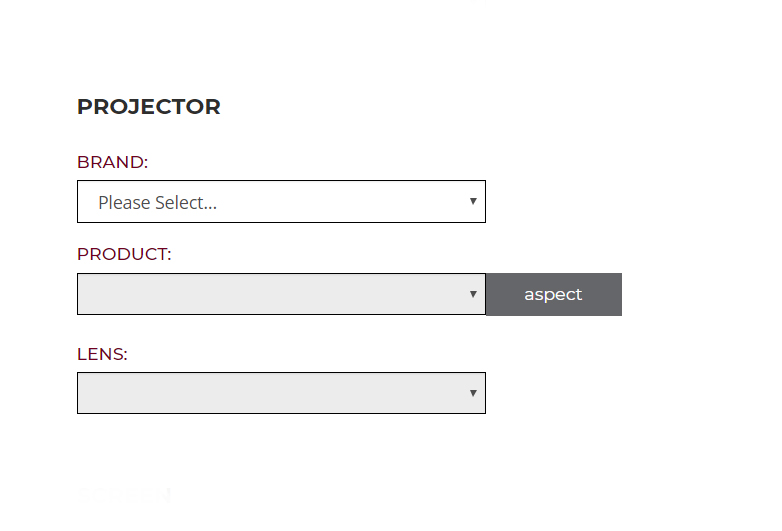
PROJECTOR
Brand:
Select the brand of projector to be included on the report
Product:
Select the projector model from the selected brand to be included on the report
Lens:
Select the lens model for the selected projector to be included on the report
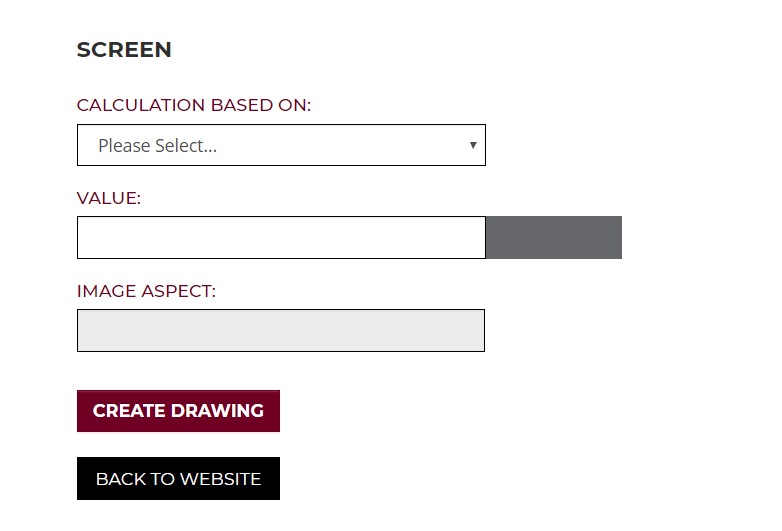
SCREEN
Calculation Based On:
Select if data to be entered in the Value field refers to the width, height or diagonal of the target image size
Value:
Enter the target image size using the units selected under Calculation Units
Image Aspect:
This is a default value based on the native aspect of the selected projector model and can not be altered
DEFAULT DATA
NONE
REPORT CONTENT
Page 1 – Title Page
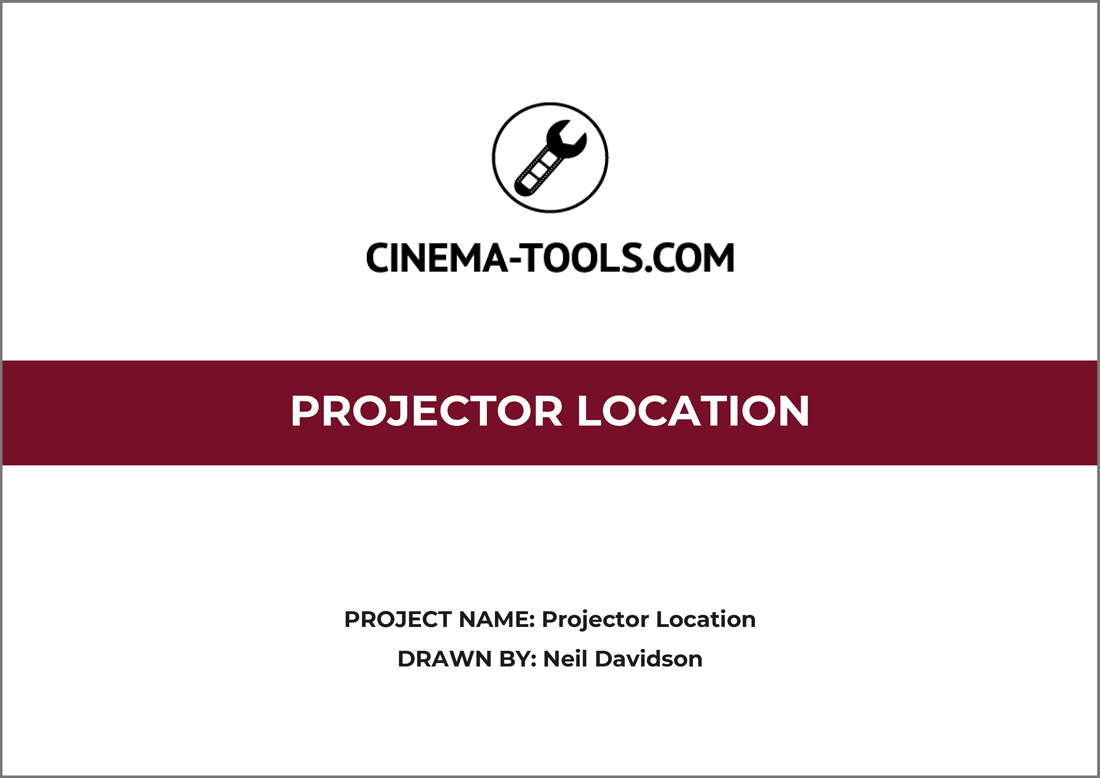
The Title page of the report is used to show:
Calculator Name: Projector Location
Project Name: As entered on the data entry page
Prepared By: As entered on the data entry page
Page 2 – Native Image Size

The Native Image Size page of the report is used to show the total projected image size of the selected combination of projector and projector lens given the requested screen size.
The projected image size is always determined by the Aspect Ratio of the chosen projector.
In cases where the projector aspect does not match the screen aspect, special care should be taken to ensure that the projected image size is correct.
The right hand data bar details:
Projector manufacturer
Projector model
Projector lens model and throw ratio
Projector aspect ratio
Native Image Width in mm and inches
Native Image Height in mm and inches
Native Image Diagonal in mm and inches
Native Image Aspect Ratio
Page 3 – Lens Shift
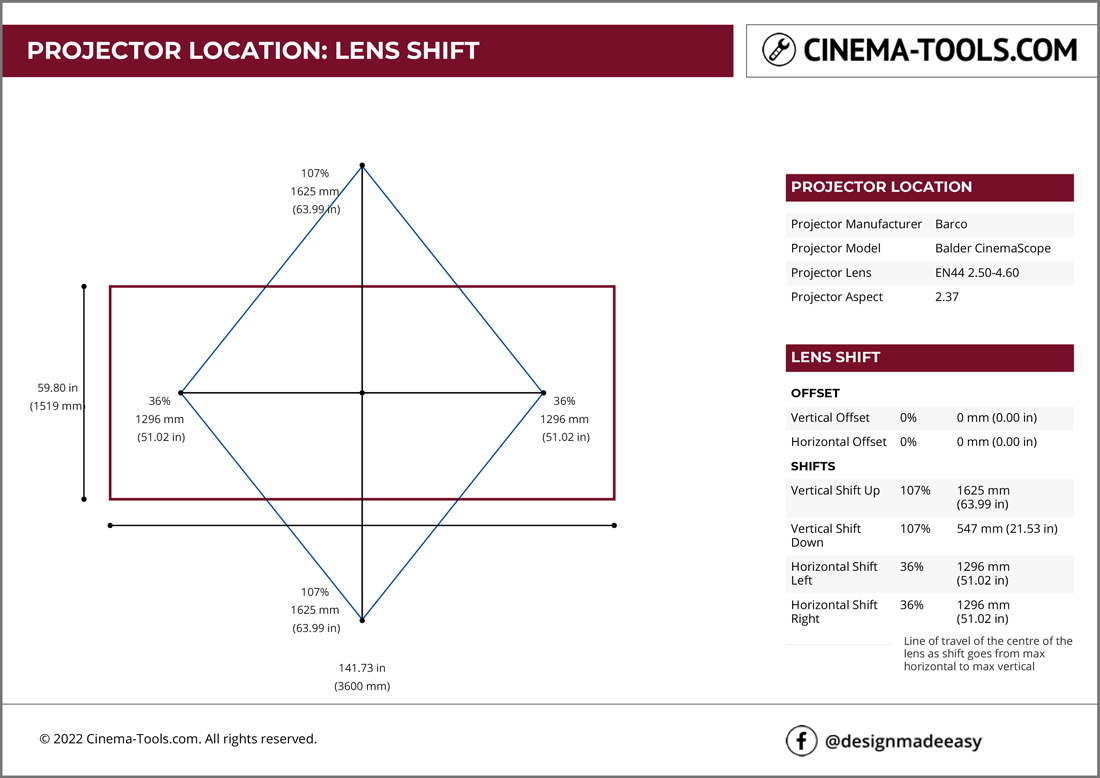
The Lens Shift page of the report is used to show the vertical and horizontal lens shift of the selected combination of projector and projector lens given the requested native image size.
The lens shift distances are always determined by the native image size shown on Page 2 of the report. In cases where the projector aspect does not match the screen aspect, special care should be taken to ensure that the projected image can be shifted correctly to fit the screen.
The layout shown assumes that the projector is in “table mount” Orientation and with a Front Projection screen.
When using lens shift, the amount of shift vertically limits the amount of shift that can also be used horizontally. The vertical and horizontal lens shift movements are shown as a black cross surrounded by a blue diamond. This diamond shape describes how much vertical and horizontal shift can be applied at the same time. To plan installation, the projector lens should be kept within the area defined by the diamond to ensure that the projected image can be shifted correctly to fit the screen.
The right hand data bar details:
Projector manufacturer
Projector model
Projector lens model and throw ratio
Projector aspect ratio
Vertical Offset in % of native image height, mm and inches
Horizontal Offset in % of native image width, mm and inches
Vertical Shift Up in % of native image height, mm and inches
Vertical Shift Down in % of native image height, mm and inches
Horizontal Shift Left in % of native image width, mm and inches
Horizontal Shift Right in % of native image width, mm and inches
Page 4 – Throw Distance

The Throw Distance page of the report is used to show the minimum and maximum throw distance of the selected combination of projector and projector lens given the requested screen size.
The minimum and maximum throw distances are always determined by the native image size shown on Page 2 of the report. In cases where the projector aspect does not match the screen aspect, special care should be taken to ensure that the projected image can be sized correctly to fit the screen.
The minimum throw distance that will deliver the required native image size is indicated by the light grey projector. The maximum throw distance that will deliver the required native image size is indicated by the black projector.
The right hand data bar details:
Projector manufacturer
Projector model
Projector lens model and Throw Ratio
Projector aspect ratio
Minimum Throw Distance in mm and inches
Maximum Throw Distance in mm and inches
Minimum Throw Range in number of native image widths
Maximum Throw Range in number of native image widths
Page 5 – Brightness Factor
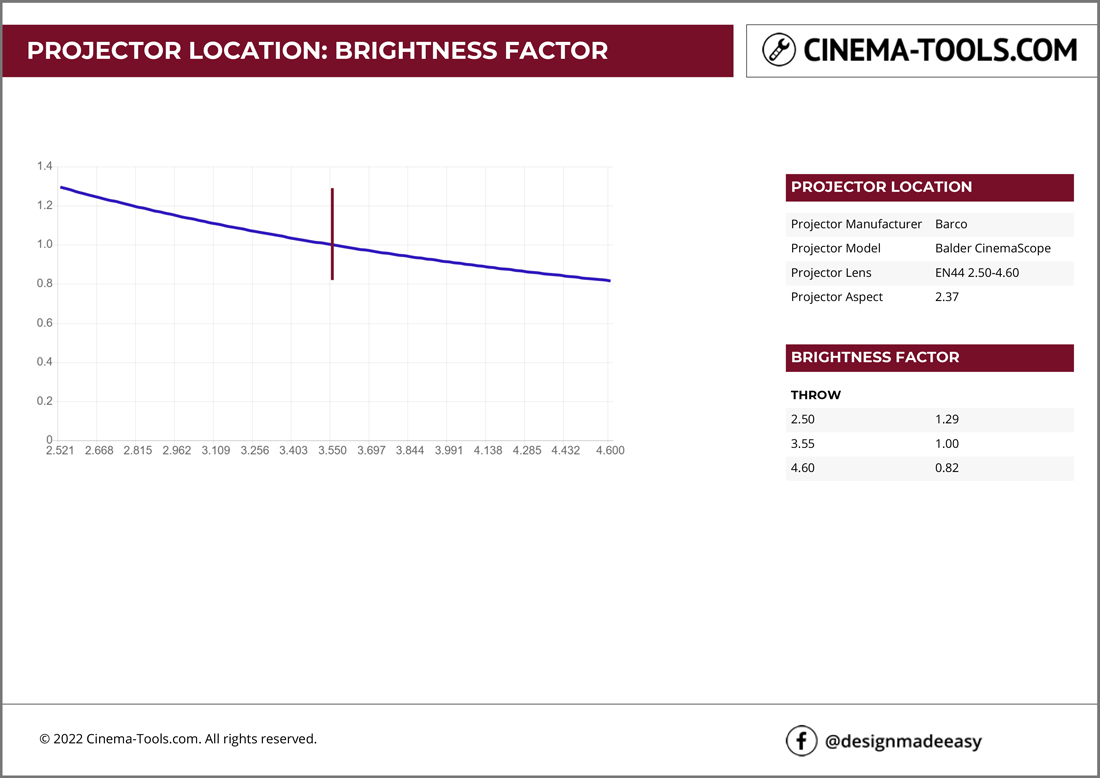
The Brightness Factor page of the report is used to show how the relative brightness of the image varies as the lens goes from minimum to maximum zoom.
On a zoom lens, the F-Stop value at the minimum lens throw value is lower than that found at the maximum lens throw value. This means that the brightness varies with the throw value.
The blue line on the chart shows how the brightness changes as the lens goes from minimum to maximum lens throw.
The maroon line on the chart indicates the mid point of the lens throw which is used by most manufacturers as the reference point when creating the brightness specification of the projector.
If the lens throw value is known, the matching brightness factor can be read from the chart and used to multiply the rated brightness of the projector to improve the accuracy of brightness calculations.
The right hand data bar details:
Projector manufacturer
Projector model
Projector lens model and throw ratio
Projector aspect ratio
Brightness Factor at Shortest Throw of Lens as a multiplication of rated lumens
Brightness Factor at Mid Throw of Lens as a multiplication of rated lumens
Brightness Factor at Longest Throw of Lens as a multiplication of rated lumens
Page 6 – Closing Page
The closing page is used to highlight the Cinema Tools facebook page designmadeeasy

PROJECTOR LOCATION CALCULATOR IS A FREE TOOL